Benchmarking Analytics
Benchmarking Analytics in Testlify: Understanding Candidate Performance
Benchmarking Analytics in Testlify provides valuable insights into candidate performance, helping organizations evaluate their candidates effectively through comparative metrics.
Where to Find Analytics in Assessments
When you navigate to any particular assessment and view the candidates' list, you’ll find an analytics section as you scroll down. This section contains two key graphs:
-
Average Pass/Fail Percentage
This graph shows the overall percentage of candidates who passed or failed the specific assessment within your organization.
Global and Assessment Averages
- Global Average: This represents the performance of all candidates across the platform who have attempted the same test.
-
Assessment Average: Reflects the average performance of all candidates who have taken the specific assessment within your organization.

These graphs provide a quick snapshot of how candidates are performing in the given assessment.
Benchmarking Analytics on the Candidate Result Page
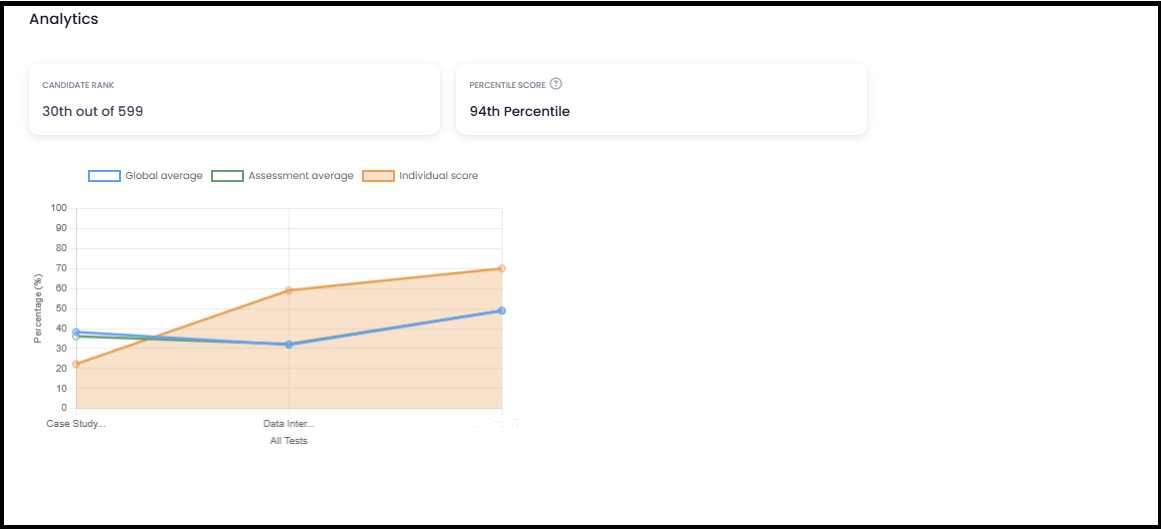
Benchmarking Analytics becomes even more detailed after a candidate completes an assessment. These insights are accessible on the Candidate Display Page (CDP) or the Candidate Result Page.
How to Access Benchmarking Analytics:
- Navigate to the Candidate Result Page after the candidate has completed the assessment.
- Scroll down to find the Benchmarking Analytics section.
What Information is Displayed?
The analytics here are represented in a graph highlighting three key metrics:
- Global Average: Reflects the average performance of all candidates who attempted the same test across the Testlify platform.
- Individual Score: This shows the score achieved by the specific candidate in the assessment.
-
Assessment Average: This represents the average score of all candidates who took this particular assessment within your organization.

These metrics help you compare the candidate's performance with their peers globally and within the assessment cohort.
This comprehensive analysis enables recruiters and hiring managers to make data-driven decisions and gain deeper insights into candidate performance relative to both internal and external benchmarks.