
How to Use Benchmarking Analytics in Testlify
Use Testlify's Benchmarking Analytics to compare any candidate's score against your organization's internal average and the platform-wide global average. This helps you make faster, data-driven hiring decisions. Analytics are available at two levels: assessment-level (across your entire candidate pool) and candidate-level (for a specific individual).
Before you begin
You need at least one published assessment with candidates who have completed it. Benchmarking data appears only after results are available.
View Assessment-Level Analytics
- Navigate to any assessment and open its Candidates list.
- Scroll down to the Analytics section.
- Review the two graphs displayed:
- Average Pass/Fail Percentage — the percentage of candidates who passed or failed this assessment within your organization.
- Global vs. Assessment Average — your organization's average score compared to the platform-wide average across all Testlify users.
Use these graphs to see how your candidate pool compares to broader industry benchmarks.

View Candidate-Level Benchmarking Analytics
- Navigate to the assessment and open the Candidates list.
- Click the candidate's name to open their Candidate Result Page.
- Scroll to the Benchmarking Analytics section.
- Review the three benchmarking metrics displayed in the graph (see below).
Understand the Three Metrics
The benchmarking graph shows three values side by side:
- Global Average — the average score of all Testlify candidates who have taken the same test.
- Assessment Average — the average score of candidates in your organization for this specific assessment.
- Individual Score — the score this candidate achieved.
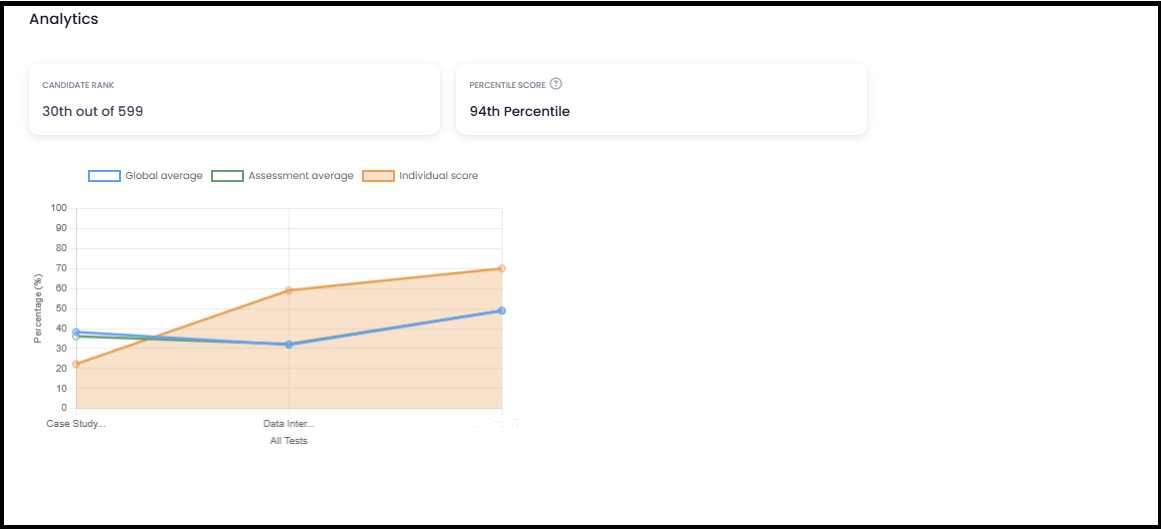
Tip: A candidate who scores above the Global Average but below your Assessment Average may still be a strong hire relative to the broader talent market. Always compare both benchmarks before making a final hiring decision.
Need help? Contact support.